
In the fictional cohort below, 20 of 35 members with comparable biomarker pairs (57.1%) have a lower follow-up value. But which members made it into that calculation? Before a percentage goes into a clinic outcomes report, the team needs to show who enrolled, whose retest window had closed, and whose two results could be compared. Put missing and unusable measurements beside the result; the available pairs alone do not describe the due cohort.
Take the fictional cohort below. Of 100 eligible members, 75 are due for retesting and 35 have comparable baseline and follow-up values. Twenty of those 35 have a lower follow-up value. 20/35 tells us about the analyzed pairs. It tells us nothing about the direction of change for the other 40 due members, clinical benefit, or a program effect. The worksheet follows each member through the denominator before a number reaches the dashboard.
Key takeaways
- Use three denominators: eligible enrolled members, members due at the lock, and members with comparable baseline and follow-up pairs.
- Do not count an open retest window as a failure. A member is not yet due until the final allowable day has closed under the stated rule.
- Give every due member a status. Missing baseline, absent retest and an uninterpretable pair need distinct reasons and owners.
- Report coverage with the result. In this illustration,
20/35 = 57.1%of comparable pairs have a lower value, while35/75 = 46.7%of due members have a comparable pair. A lower value for an unnamed marker is not necessarily a health improvement.
Evidence scope
The STROBE cohort checklist asks observational-study authors to define eligibility, dates, variables and measurement sources; report numbers at each stage and missing data; and discuss bias and limits. We adapt those transparency principles to an operational clinic worksheet. This fictional program is not a research study, and the worksheet does not claim STROBE compliance. An AHRQ white paper on missing data in patient registries addresses missing data in an adjacent setting, not longevity-clinic prevalence. CLSI EP31 Plus addresses quantitative result comparability within one health care system, not a universal pairing rule. FDA’s account of surrogate endpoints limits what biomarker movement can establish about clinical benefit.
All dates, counts, status reasons and marker directions below are invented. There are no real member data, effect estimate or demonstrated HolistiCare feature behind this illustration. A clinic’s clinical and laboratory owners must set appropriate intervals and interpretation rules for its own program.
How do you define the enrolled cohort?
Start with a roster that another reviewer could reproduce. Name the program and version, set the enrollment period, and count each member’s first qualifying entry once. Decide in advance how to handle duplicates, transfers, re-enrollment and corrected entry dates. Save the roster with the rule version. A member who leaves later stays in the original enrollment count unless a predeclared rule says otherwise; record the exit and explain any later roster revision.
In this fictional six-month program, the enrollment period runs from 1 January through 30 April 2026, inclusive. The team screens 120 records: 12 fall outside those dates and eight belong to another program. That leaves 120 − 12 − 8 = 100 distinct eligible members. Those 20 exclusions need selection reasons, but they are not missing outcomes. If the clinic adds more criteria, it should order them before counting so each excluded record has one primary reason. This is an editorial application of STROBE’s request to explain selection and numbers at each stage.
What must the cohort definition retain?
Record the program/version, entry timestamp and source, one-member counting rule, inclusion and exclusion reasons, named measurement, allowable baseline and follow-up windows, and result selection when several samples qualify. Preserve collection date separately from result arrival date. These are proposed fields, not STROBE’s prescribed data model. Resolve source and identity gaps in the longitudinal record before finalizing the denominator. An imported duplicate must not silently create a second member.
Who is due for retesting at the data lock?
A member who enrolled in January and one who enrolled in April have not had the same follow-up opportunity by August. This fictional report locks at the end of 31 August 2026, in the clinic’s specified local time zone. Its clinical team chose a target six calendar months after each member’s entry and an allowable window from 14 calendar days before through 14 calendar days after that target. A member is “due” for this report only when the final allowable day has closed by the lock. These dates are bookkeeping assumptions for the example, not retesting advice for any analyte.
The entry dates make the distinction concrete. Seventy-five of the 100 entered from 1 January through 14 February; the other 25 entered from 1 March through 30 April. The latest early entrant reaches the six-month target on 14 August, with a final allowable day of 28 August. All 75 early entrants’ windows had closed by the 31 August lock. The earliest later entrant reaches the target on 1 September, with a final allowable day of 15 September. None of those 25 is due, even if part of a window has begun: 100 = 75 due + 25 not yet due. Of the pending 25, 20 have a baseline and five do not. Neither group is a retest failure at this lock.
Write the due rule in dates
Specify the entry-date source, calendar convention, target, window endpoints, lock time zone and due transition. State how withdrawals, transfers, program revisions and results arriving after the lock are handled. An early or late second value needs a status; finding it in a chart does not make it the predeclared retest. At a later lock, pending members may become due and unresolved results may arrive. Retain the older locked report so changes can be traced to roster and status revisions.
Which due members have comparable baseline and follow-up pairs?
The due cohort is 75, but due does not mean analyzable. Under the clinic’s predeclared entry window and validity rules, 15 lack a valid baseline for the named measurement. A later value alone cannot show change from entry. That leaves 60 with a valid baseline.
Gate 1: Was a follow-up result recorded?
Among those 60 baseline-available, due members, 15 have no follow-up result recorded at all by the lock: six missed the planned appointment, five declined retesting and four have a result that was not obtained by the reporting team. These are fictional documentation states, not explanations of anyone’s marker direction. The other 45 have a follow-up result present.
A team might present 45/60 = 75% as a completion rate. The precise label is retest presence among due members with a valid baseline. It is not completion among all 100 enrolled, and some of the 45 still cannot enter an interpretable comparison. The separate article on why follow-up breaks down after the first assessment covers operational causes; here the reporting status and owner stay visible.
Gate 2: Can the two values be interpreted as a pair?
Having two values is the next gate, not the end of the review. Of the 45 with both values present, 10 are held out of this paired description: six involve a changed method or platform without documented comparability review, and four have a follow-up sample outside the chosen window. Under the illustration’s rules, 35 pairs remain. The six method cases are pending review; different platforms are not automatically incomparable.
CLSI’s public EP31 scope addresses verifying quantitative result comparability across instruments within one health care system and has scope limits; it does not supply a blanket cross-system answer. The laboratory and clinical owners should inspect the actual analyte, method, units and context. Record source laboratory, assay/platform, unit, collection date, validity decision, reviewer and reason for any hold. An unreviewed conversion is not a comparable pair merely because software can calculate a difference.
Fictional cohort reporting worksheet: 120 records to 35 pairs
At one versioned data lock, use this sequence:
- Fix the rule: program/version, one entry per member, enrollment and eligibility rules, named measurement, baseline and retest windows, due transition, time zone and lock.
- Reconcile selection:
120 screened − (12 outside dates + 8 other program) = 100 eligible enrolled. - Separate time eligibility:
100 eligible = 25 not yet due + 75 due. Keep the pending 25 on the roster. - Classify every due member once:
75 due = 15 no valid baseline + 15 valid baseline/no recorded retest + 10 retest present but uninterpretable pair + 35 comparable pair. - Label the result and its coverage:
35/75 = 46.7%of due members have comparable pairs;40/75 = 53.3%cannot support this paired summary. Within the 35 pairs, 20 values are lower and 15 are not lower under the predeclared direction rule.
| Stage or mutually exclusive status | Count | Denominator or reconciliation | Reason / next review owner |
|---|---|---|---|
| Records screened | 120 | Selection pool | Confirm entry and program source / operations |
| Excluded before enrollment | 20 | 12 outside dates + 8 other program | Verify primary reason / operations |
| Eligible enrolled | 100 | 120 − 20 | Freeze one-member roster / operations |
| Not yet due | 25 | 20 with baseline + 5 without | Reassess at later lock / program team |
| Due at lock | 75 | 100 − 25 | Resolve individual window / program team |
| Due; no valid baseline | 15 | Part of 75 | Review source or validity / clinical and data owners |
| Due; valid baseline, no recorded retest | 15 | 6 missed + 5 declined + 4 result unobtained | Investigate workflow and source / program team |
| Due; retest present, pair uninterpretable | 10 | 6 method review pending + 4 outside window | Review method or timing / laboratory and clinical owners |
| Due; comparable pair | 35 | 75 − 15 − 15 − 10 | Apply declared comparison / clinical reviewer |
Editorial worksheet adapted from STROBE reporting transparency and adjacent missing-data registry and laboratory comparability contexts. The five states, dates and counts are editorial constructs; this is not a validated tool, clinical decision rule, score, product screenshot or evidence of HolistiCare functionality. Excluded-reason and not-yet-due subtotals are nested; do not add them again to the 100-member reconciliation.
For a reusable blank record, copy these fields with the table: roster ID and version; one-member entry ID/date/source; eligibility decision and primary reason; measurement and baseline/retest collection dates; due target/window and lock time zone; result source, method and unit; single due-status code and reason; comparability decision and qualified reviewer; comparison-direction rule; report lock, update date and limitations. Aggregate counts should be reproducible from those records while member-level information remains under the clinic’s controls. Retain the six, five and four absent-retest reasons as documentation states rather than merge them into a supposed outcome category.
What can the clinic say from these numbers?
Here is a narrow example of report copy:
“At the 31 August 2026 lock, 75 of 100 eligible enrolled members had completed the clinic-defined opportunity for a retest of one specified measurement. Thirty-five of those 75 had a comparable baseline/retest pair (46.7% coverage). Among the 35 pairs, 20 (57.1%) had a lower follow-up value and 15 did not under our predeclared direction rule. Forty due members lacked an interpretable pair: 15 had no valid baseline, 15 had no recorded retest, and 10 had a present but unusable pair. The direction of change for these 40 is unknown from this analysis.”
20/75 = 26.7% is the fraction of due members with a documented lower comparable value, not the proportion whose health improved. Do not call the remaining 55 due members “nonresponders”: 15 comparable pairs are known not to be lower; 40 have no interpretable pair. Nor does 35/100 = 35% comparable-pair coverage among all eligible members replace 35/75: the first includes 25 people who were not yet due.
Why show coverage beside the percentage?
A slide that shows only 20/35 hides the path from 75 due members to 35 analyzed pairs. Missing follow-up could relate to a member’s experience or health, but this example establishes neither a mechanism nor a direction. A missed appointment, declined test or unavailable report is not a high, low or unchanged value. The clinic can investigate those patterns in a later report while retaining the locked descriptive result. STROBE asks research reports to describe missing data and discuss potential bias; the registry missing-data context likewise gives reason to investigate unresolved follow-up rather than assume it is random.
The unnamed marker has no declared beneficial direction or clinical threshold. Even a well measured lower value is not, on its own, a clinical outcome or evidence that a program caused a benefit. FDA distinguishes surrogate endpoints from direct measures of clinical benefit, with use tied to the evidentiary context. For the broader interpretation boundary, read why biomarker change alone does not prove clinical benefit. A qualified clinician and laboratory professional would need to consider the named analyte, analytical and biological variation, clinical context and other endpoints before any member-facing interpretation. No such assessment is performed here.
What should an outcomes dashboard or demo reveal?
Ask these questions before using a displayed percentage for a program report:
- Can the team show the eligibility rule and saved roster version, including exclusions and duplicate resolution?
- How does each member’s entry date produce a due state at a stated lock, and where do not-yet-due members remain visible?
- Can a reviewer distinguish no valid baseline, no recorded retest and a present but uninterpretable pair, with reasons and owners?
- Are the source, method, unit and collection date available for each value, and who makes a comparability decision?
- Can the reported 35 pairs and 75 due members be traced to records, a locked report and any later revision?
- What is shown live, what depends on manual work or configuration, and what still needs technical discovery?
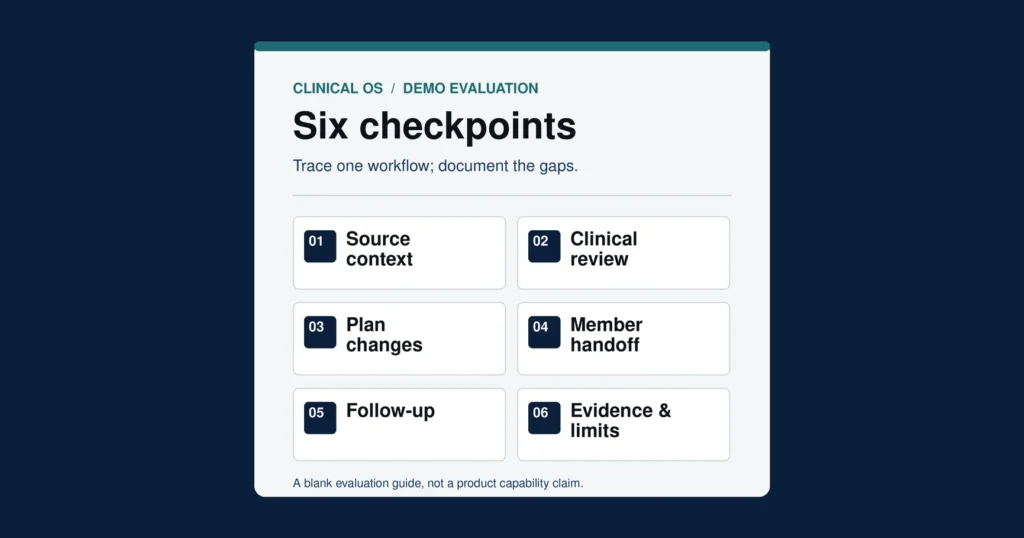
Cohort reporting is one part of the wider longevity clinic operating system and its longitudinal handoffs. Bring the same fictional scenario to a demo and use the Clinical OS demo checklist to record what appears on screen. The questions are tests for the conversation, not claims that HolistiCare currently automates this worksheet.
Conclusion: keep the due cohort visible
The final report should let a reader trace the result back to the roster and the due rule. Show 20/35 beside 35/75 coverage and account for the 40 due members without an interpretable pair. A qualified team can then interpret what was measured without treating missing values as known outcomes.
Bring a fictional cohort definition to a HolistiCare workflow demo. Ask the team to show how denominators, missing results and review decisions would be handled. Use the demo checklist to distinguish a live demonstration from a described or future workflow.
HolistiCare provides clinical decision-support infrastructure; it is not a licensed medical provider or electronic health record. All diagnostics, care protocols, and clinical decisions remain exclusively the responsibility of qualified healthcare professionals. Insights generated by HolistiCare’s AI engine are for clinical and informational use only and do not constitute medical advice, diagnosis, or treatment.
References
- STROBE Statement, checklist for cohort studies, items 5–9, 12–14 and 19–21. Reporting transparency for observational research, adapted here to an operational worksheet.
- Agency for Healthcare Research and Quality, Managing Missing Data in Patient Registries, “Reasons for Missing Data.” Registry methods context; not longevity-clinic evidence.
- Clinical and Laboratory Standards Institute, EP31 Plus, second edition: public abstract and scope. Quantitative patient-result comparability within one health care system; the full standard was not used to derive a rule here.
- U.S. Food and Drug Administration, Public Posting of a Comprehensive Surrogate Endpoint Table for CDER- and CBER-Regulated Products. Terminology and limits for surrogate endpoints; no endorsement of the fictional marker.