Clinical note: This article is an editorial on clinical operations and data architecture. HolistiCare.io is a clinical decision-support platform; it does not diagnose or treat patients. The automation features described are designed to assist licensed clinicians, not replace professional judgment.
The volume of biomarker data available to modern longevity physicians is staggering, yet the mechanisms for processing this data remain archaic. This article explores the technical implementation of Lab Automation, Optical Character Recognition (OCR), and Natural Language Processing (NLP) within the HolistiCare ecosystem. We detail how automating the ingestion and interpretation of specialty labs (DUTCH, OAT, GI-MAP) transforms clinical operations from a data-entry bottleneck into a clinical intelligence engine.
The Data Ingestion Bottleneck
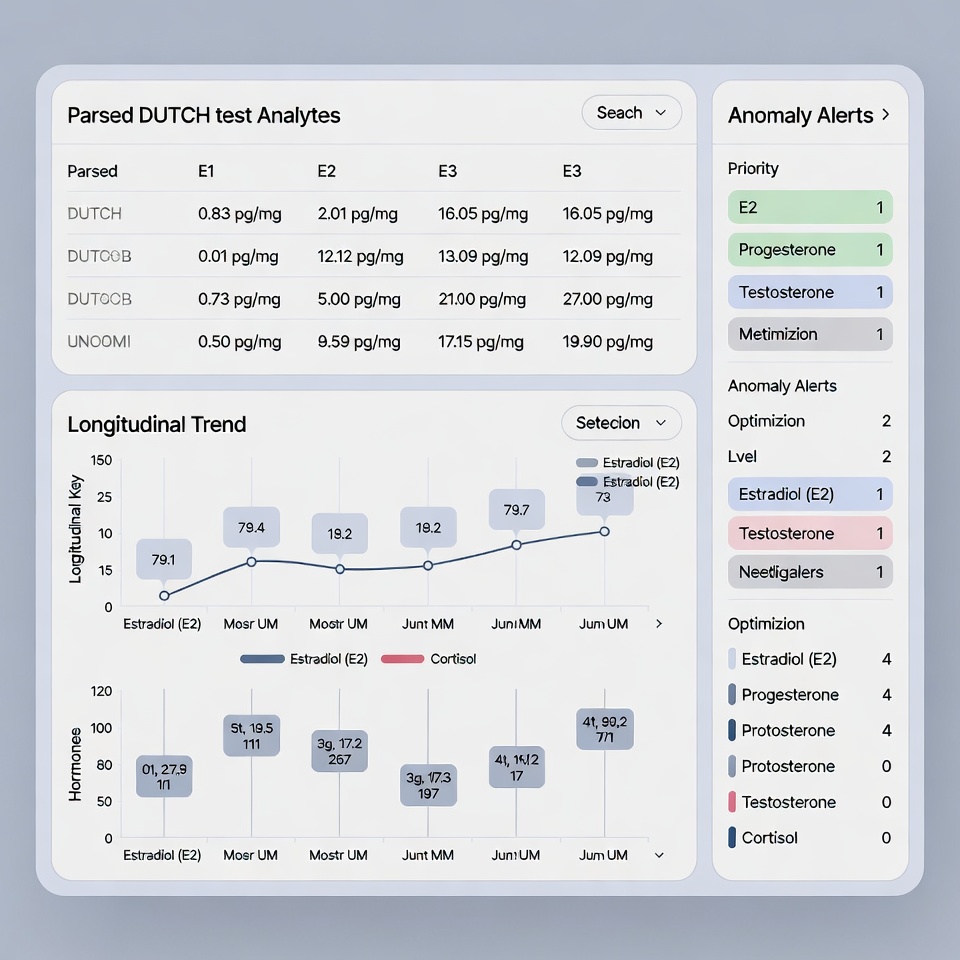
In the current landscape of functional medicine, the “Specialty Lab” is the gold standard for diagnostics. Unlike standard serum labs from Quest or Labcorp, specialty labs—such as the Dried Urine Test for Comprehensive Hormones (DUTCH), Organic Acids Tests (OAT), or complex microbiome sequencing (GI-MAP)—provide a high-fidelity view of a patient’s physiology.
However, these reports are notoriously dense. A single OAT profile can contain over 70 markers regarding mitochondrial function, neurotransmitter metabolites, and fungal toxins.
The operational reality for most clinics is the “Swivel Chair Interface”: The physician swivels between a PDF report on one screen and their EHR on the other, manually typing values into the note. This process is:
- Error-Prone: Transcription errors are a leading cause of preventable documentation discrepancies.
- Time-Intensive: It takes 15-20 minutes to thoroughly analyze and chart a complex panel.
- Data-Destructive: Once the PDF is filed, the data is essentially “dead.” It cannot be easily used for population analytics.
The Technology of Extraction: OCR and NLP
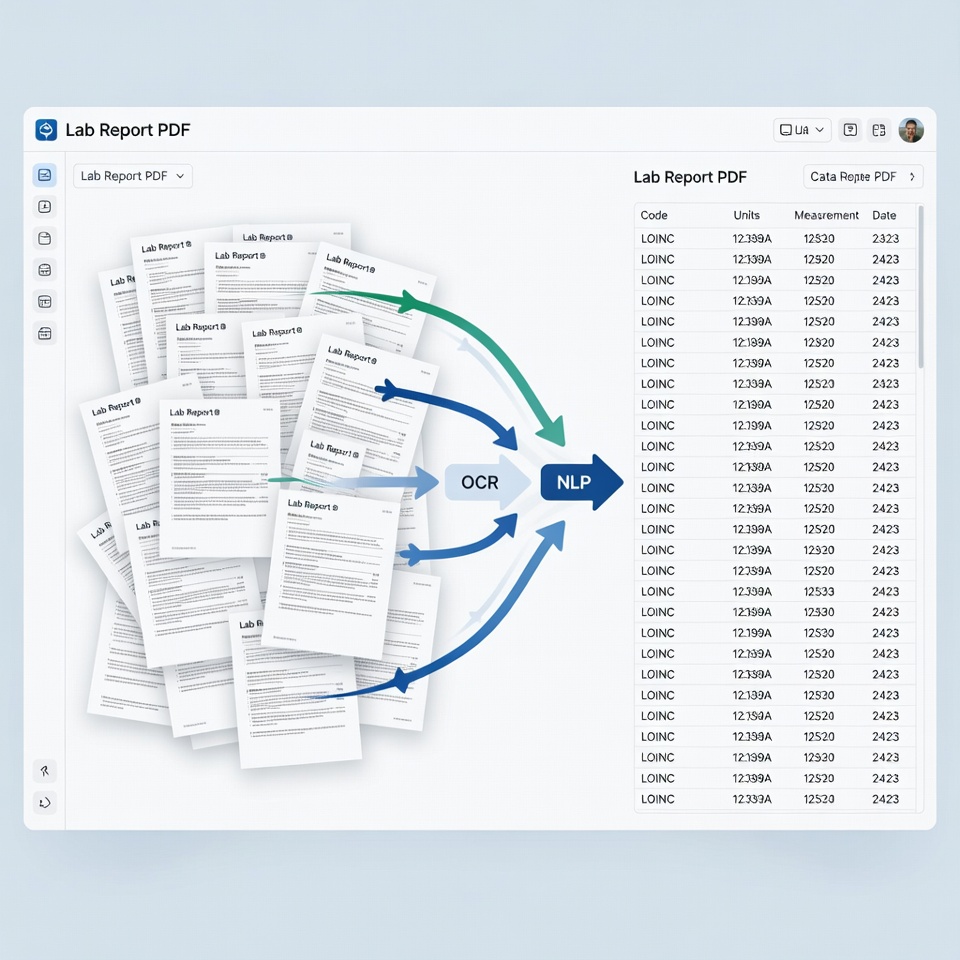
At HolistiCare.io, we approach lab reports as raw data sources. We utilize a proprietary pipeline combining Optical Character Recognition (OCR) with context-aware Natural Language Processing (NLP).
Step 1: Intelligent OCR
Standard OCR can “read” text on a page. Clinical OCR must understand layout. Specialty lab reports are often non-standardized; a value might be in Column A, the reference range in Column C, and the flag in Column D.
Our system is designed to map the specific “geography” of reports from over 45 major functional labs. When a PDF is uploaded, the system:
- Identifies the Lab Vendor (e.g., Precision Analytical).
- Locates the tabular data structure.
- Extracts the numerical value and the unit of measurement.
Step 2: Semantic Normalization
This is the critical step. Different labs use different names for the same biomarker.
- Lab A calls it: “HbA1c”
- Lab B calls it: “Glycated Hemoglobin”
- Lab C calls it: “Hemoglobin A1c”
Our NLP engine utilizes the LOINC (Logical Observation Identifiers Names and Codes) standard to map these variations to a single, universal identifier. This standardization ensures that when you view a longitudinal graph of a patient’s blood sugar over five years, data from distinct lab vendors (e.g., Labcorp, Cleveland HeartLab, and a local hospital) is plotted on the same trajectory.
Beyond Reference Ranges: The “Functional” Overlay
Once the data is digitized, we apply the “Intelligence Layer.”
As discussed in previous analyses, standard reference ranges are designed to identify pathology (disease), not dysfunction (sub-optimal health). A patient with a Vitamin D level of 31 ng/mL is considered “Normal” by most labs (Range: 30-100). However, in longevity medicine, levels between 30-50 ng/mL may be insufficient for optimal genomic stability and immune modulation.
The HolistiCare Automation Engine allows clinics to:
- Define Protocol Ranges: Set your clinic’s specific “Green Zone” (e.g., Vitamin D > 60 ng/mL).
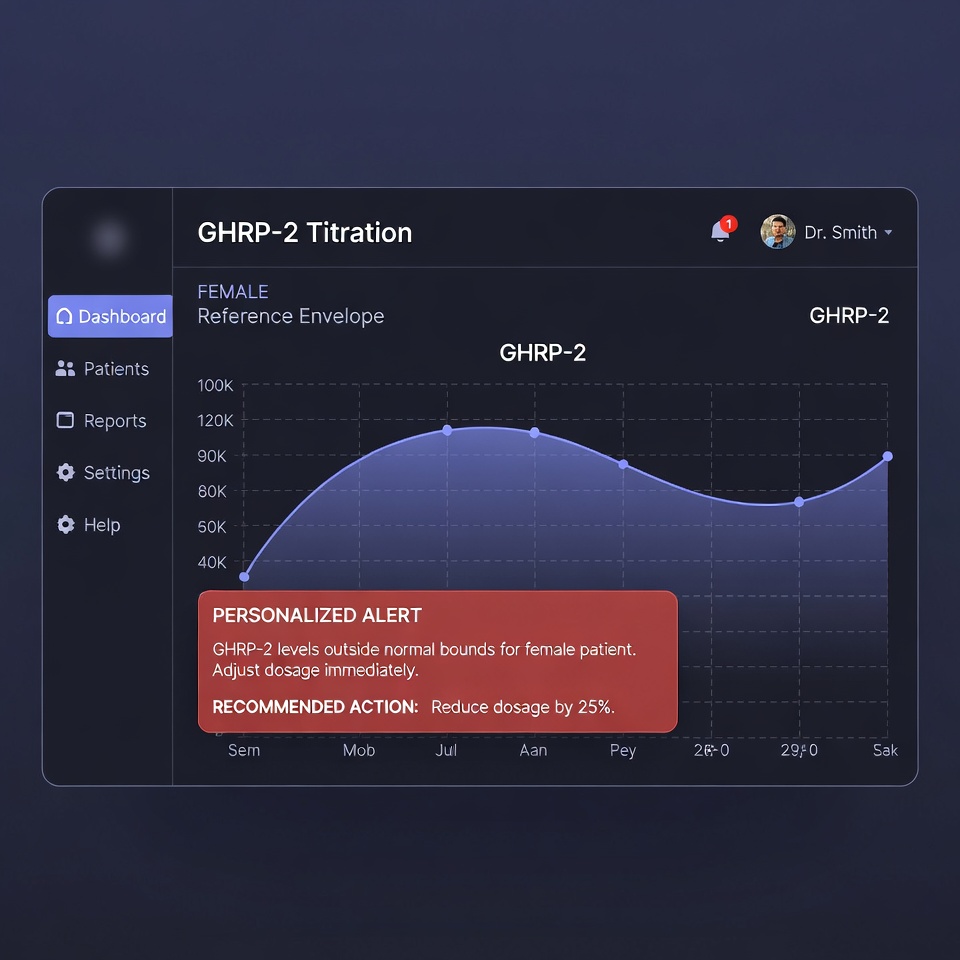
- Automate Logic: When a result is ingested, the system applies your rules:
IF Vitamin_D < 60 THEN Tag = "Sub-Optimal". - Surface for Review: The physician’s “Inbox” is no longer just a chronological list of PDFs. It becomes an organized queue where patients with values outside your defined optimal ranges are highlighted for faster review.
Clinical Decision Support (CDS) vs. “AI Doctor”
It is vital to distinguish between Clinical Decision Support (CDS) and “AI Diagnostics.”
HolistiCare is a CDS system. We do not diagnose the patient. We prepare the data so the physician can assess the patient with greater speed and accuracy.
The Workflow:
- Ingest: System reads the OAT test (e.g., identifying elevated Arabinose).
- Analyze: System flags the value based on your clinic’s thresholds.
- Draft: The AI drafts a suggested snippet for the clinical note: “Lab findings indicate potential fungal dysbiosis (Elevated Arabinose: 45 mmol/mol). Consider review of anti-fungal protocol.”
- Review: The physician reviews the suggestion. They can accept, edit, or reject it with one click.
This “Human-in-the-Loop” architecture ensures that the physician remains the ultimate authority and liability holder, while the platform functions as a tireless, high-precision research assistant.
Scalability: The Multi-Omics Future
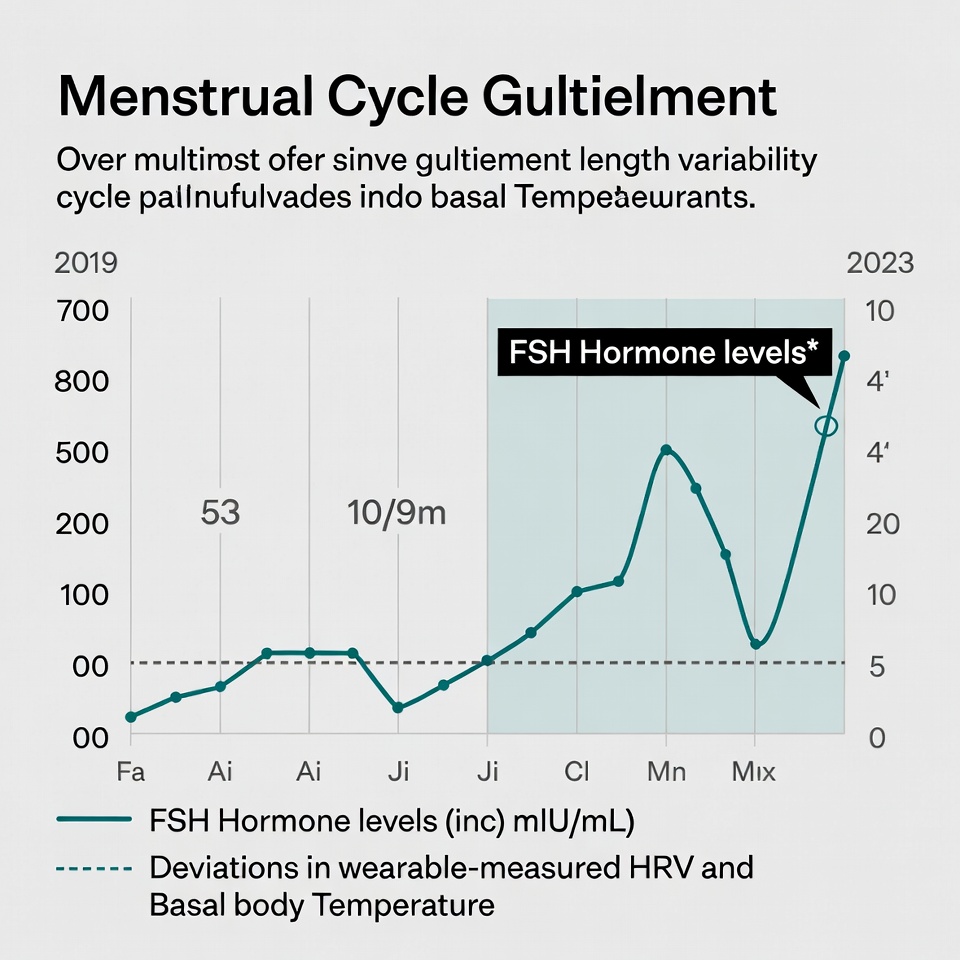
The future of longevity is “Multi-Omics”—the integration of Genomics, Proteomics, Metabolomics, and Microbiomics.
No human brain can efficiently cross-reference a patient’s APOE4 genotype (Genomics) with their Lipid Particle Number (Proteomics) and their Gut Diversity Score (Microbiomics) to calculate a composite cardiovascular risk score in real-time without computational aid.
Computers excel at this. By automating the ingestion of these diverse data streams, HolistiCare enables the “High-Performance Physician”—a provider who leverages computation to practice medicine at a level of complexity that was previously operationally prohibitive.
Conclusion
If your clinic’s strategy for 2026 relies on manual data entry, you are building a business model that scales linearly with headcount. To scale exponentially—increasing revenue without linearly increasing physician burnout—you must automate the interpretation layer. By turning the “PDF Graveyard” into a living database, you unlock the true asset value of your clinical practice.
References & Citations
- Regenstrief Institute. “LOINC (Logical Observation Identifiers Names and Codes).” loinc.org, Accessed Feb 2026.
- Obermeyer, Z., & Emanuel, E. J. (2016). “Predicting the Future – Big Data, Machine Learning, and Clinical Medicine.” New England Journal of Medicine, 375(13), 1216-1219.
- Sittig, D. F., & Singh, H. (2010). “A New Sociotechnical Model for Studying Health Information Technology in Complex Adaptive Healthcare Systems.” Quality and Safety in Health Care, 19(Suppl 3), i68-i74.
- Kalra, D. (2006). “Electronic Health Record Standards.” Yearbook of Medical Informatics, 15(01), 136-144.
- Food and Drug Administration (FDA). “Clinical Decision Support Software: Guidance for Industry and Food and Drug Administration Staff.” FDA.gov, 2022.
Disclaimer: The information in this article is for educational and informational purposes only and does not constitute medical, legal, or financial advice. HolistiCare.io is a B2B Clinical Decision Support (CDS) platform and is not intended to independently diagnose, prescribe, or treat medical conditions. The automated interpretation features described are designed to highlight trends and deviations based on user-defined parameters. Final diagnosis and treatment decisions remain the sole responsibility of the licensed healthcare provider. Mentions of specific diagnostic tests (DUTCH, OAT, GI-MAP) or third-party labs are for illustrative and compatibility purposes only and do not imply partnership or endorsement.